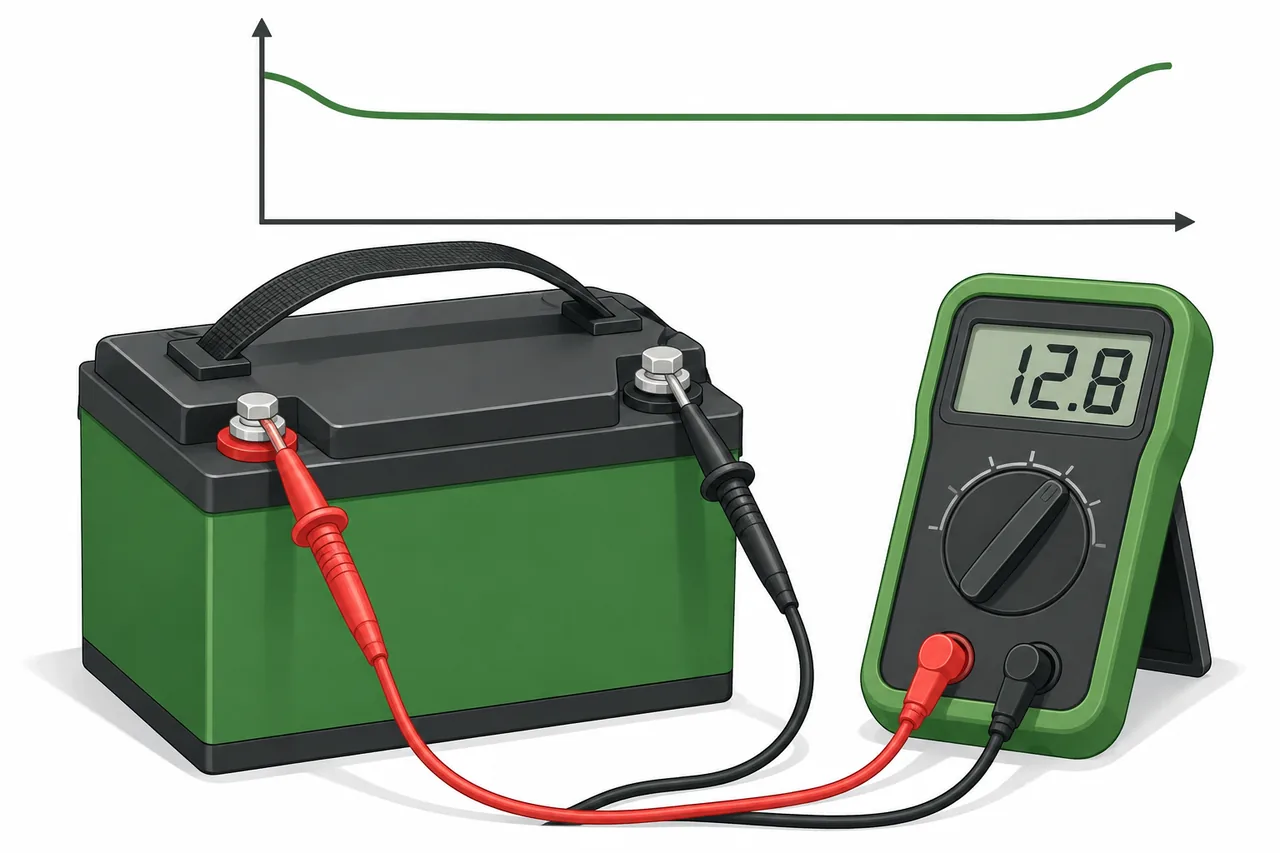
What a LiFePO4 voltage chart can tell you
A LiFePO4 voltage chart compares an open-circuit battery voltage with an approximate state-of-charge range. It is most useful for a quick check on a stable, rested pack. A single pack-terminal reading cannot reveal the voltage of every cell group, prove the battery's usable capacity, or identify a weak cell. Treat the estimate as a starting point for observation rather than a pass-or-fail test.
A nominal 12.8-volt LiFePO4 battery commonly has four cells in series, or 4S. The nominal label is not a charge target and is not the voltage at every state of charge. Charging voltage rises above nominal, while a load can pull terminal voltage down. The chart below is for resting voltage after the surface effects of charging or discharging have eased.
- Do not use a charging or loaded reading as a rested-voltage lookup.
- Do not infer exact remaining runtime from voltage alone.
- Follow the battery maker's limits before changing a charger or protection setting.
LiFePO4 resting voltage chart by approximate SOC
This broad reference uses common 3.2-volt nominal cells and shows how the same per-cell reading scales across 4S, 8S, and 16S packs. The SOC bands are intentionally approximate: published charts differ because manufacturers use different cells, test currents, rest periods, temperatures, and endpoints. Use your battery documentation when it provides a model-specific table.
Values in a row are arithmetic examples, not universal limits. For example, 3.30 volts per cell becomes about 13.2 volts for 4S and 26.4 volts for 8S. A measurement between rows should be read as a range, not rounded into a precise percentage.
| Approx. SOC band | Resting V per cell | 4S pack | 8S pack | 16S pack |
|---|---|---|---|---|
| 90-100% | 3.35-3.40 V | 13.4-13.6 V | 26.8-27.2 V | 53.6-54.4 V |
| 70-90% | 3.30-3.35 V | 13.2-13.4 V | 26.4-26.8 V | 52.8-53.6 V |
| 40-70% | 3.25-3.30 V | 13.0-13.2 V | 26.0-26.4 V | 52.0-52.8 V |
| 20-40% | 3.20-3.25 V | 12.8-13.0 V | 25.6-26.0 V | 51.2-52.0 V |
| Below about 20% | Below about 3.20 V | Below 12.8 V | Below 25.6 V | Below 51.2 V |
Convert cell voltage to pack voltage by series count
Cells connected in series add their voltages. To make a first-pass comparison, multiply the per-cell reference by the number of series cells: four cells at 3.30 volts are about 13.2 volts, while eight are about 26.4 volts. Confirm the actual series count from the battery label or documentation instead of guessing from a 12V, 24V, or 48V product name.
Cells connected in parallel add capacity, not voltage. A 4S2P pack still uses the 4S voltage reference even though it has two parallel cell groups at each series position. Some systems marketed as 48V use a different series count; check the nominal voltage and chemistry before comparing any chart.
- 4S is commonly labeled 12.8V nominal; its cell voltages still need individual monitoring.
- 8S is commonly labeled 25.6V nominal, and 16S is commonly labeled 51.2V nominal.
- Parallel strings change amp-hour capacity and current sharing, not the series-voltage calculation.

How to measure LiFePO4 resting voltage
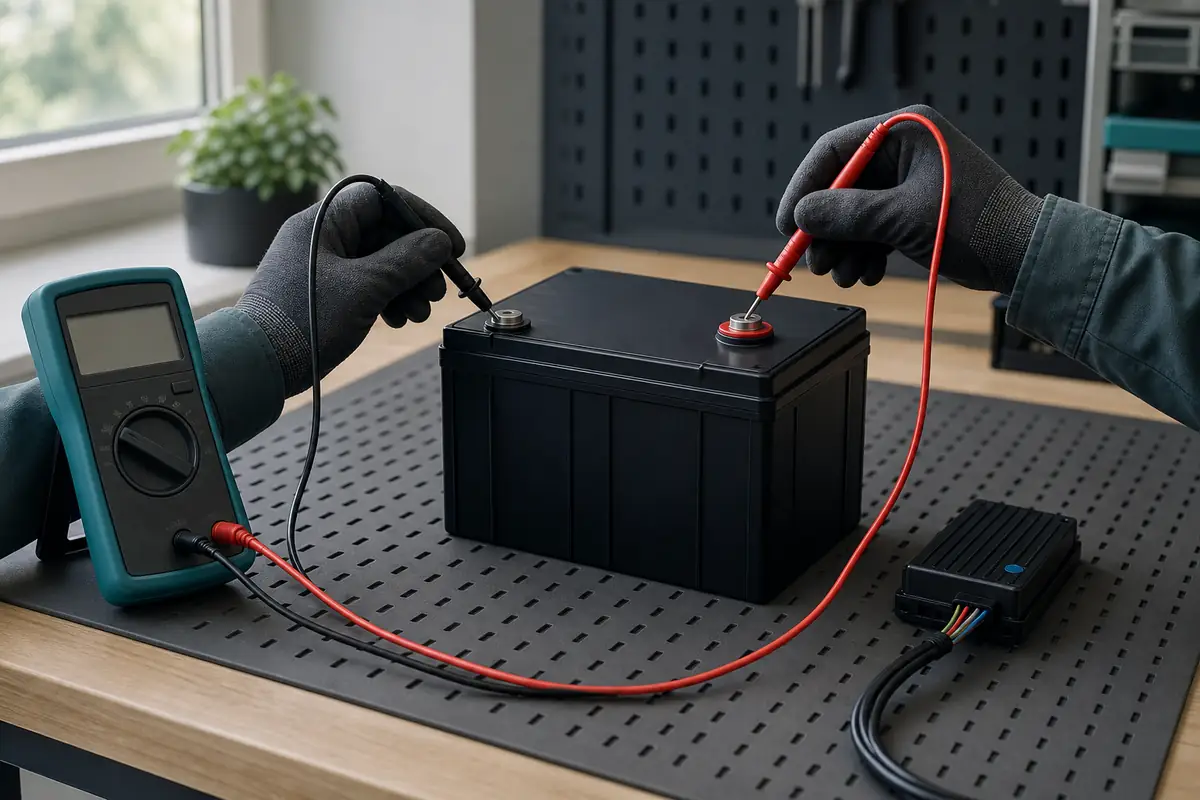
For a useful comparison, measure at the battery terminals with a suitable digital multimeter, correct DC-voltage range, and probes in the meter's voltage sockets. Keep the probes from bridging adjacent terminals. If the battery is damaged, wet, unusually hot, swollen, leaking, or giving off an unusual odor, stop and use qualified service rather than continuing measurements.
After charging or discharging, disconnect the charger and loads and allow the pack to settle according to its manual. Record the time, temperature, whether anything was connected, and the total pack voltage. A quick reading immediately after charge can be temporarily elevated; a reading during a heavy load can be lower than the rested value.
- Verify chemistry, series count, polarity, meter leads, and voltage range first.
- Measure in a dry, clear area; remove loose conductive objects from the terminals.
- Do not short terminals, bypass a fuse, or disable BMS protection to obtain a reading.
- Compare the meter with compatible BMS cell and pack readings when available.
Why pack voltage does not give an exact SOC
LiFePO4 has a broad, relatively flat middle voltage plateau. A meaningful change in stored charge may produce only a small change in pack voltage, so meter precision cannot remove the uncertainty in the chart itself. Two battery models can show different resting voltages at a similar SOC, and the same pack can read differently just after charge, after a long rest, or under load.
Temperature, cell age, imbalance, wiring resistance, and the measurement point also matter. Pack voltage is the sum of all series groups: one low cell can be hidden by the total. If the BMS reports cell-level voltage, spread, temperature, or an alarm, review those readings alongside pack voltage and compare them with the exact battery specification.
- A rested total voltage is an estimate, not a capacity test.
- An imbalanced pack can have a plausible total while one cell group is outside its normal range.
- Use a coulomb-counting BMS only when its capacity setting and current measurement are configured correctly.
Compare the chart with the BMS state-of-charge reading
A compatible BMS may estimate SOC by tracking current into and out of the pack, then correcting its estimate at known charge points. This can be more useful during normal operation than a voltage-only lookup, but it is not automatically accurate. The battery capacity, current sensor, wiring, and synchronization settings must match the pack and installation.
If the chart and BMS disagree, first compare like with like: note whether the pack is resting, charging, or supplying a load, then check cell voltages and recent current history. Do not raise over-voltage or under-voltage limits just to make displayed percentages agree. Use the maker's documentation to diagnose persistent differences; a voltage chart cannot calibrate the BMS.
- Check total voltage and individual cell-group readings together.
- Review recent charging and discharge current before interpreting a sudden SOC change.
- Treat repeated protection alarms or abnormal cell spread as a diagnostic issue, not a chart mismatch.
When a low reading needs attention
A low resting value is a prompt to check the model-specific operating range, recent load, and cell-level BMS data. Do not intentionally discharge to a generic chart endpoint. The lowest cell voltage allowed by a datasheet is not necessarily a sensible everyday target, and a protection cutoff is not a recommended routine stopping point.
Stop using and charging a pack if it is physically damaged, overheating, swelling, leaking, or repeatedly entering protection. If one cell group is much lower than the others, the pack voltage alone is not enough to decide that continued use is safe. Follow the manufacturer's service instructions or ask a qualified battery technician.
LiFePO4 voltage chart FAQ
What voltage is a 12V LiFePO4 battery at 50%?
A common 4S resting-voltage reference places the middle of the charge range around 13.0-13.2V, but different batteries and test conditions vary. Use the model-specific chart and cell readings when accuracy matters.
Is 13.2V a full LiFePO4 battery?
Not necessarily. Around 13.2V can fall within the broad middle-to-high resting range for some 4S packs, while charging voltage is a different measurement. Rest the pack, confirm series count, and consult its manual.
Should I use voltage while the battery is charging to estimate SOC?
No. Charging voltage depends on the charger stage and current, so it does not map directly to resting SOC. Compare only after disconnecting the charger and allowing the pack to settle.
Does a 48V LiFePO4 pack always use a 16S chart?
No. Many 51.2V nominal packs are 16S, but products sold in the 48V class can use other configurations. Verify the actual series count and nominal voltage on the label or datasheet.
Can pack voltage show whether every cell is healthy?
No. Total voltage can hide a low or imbalanced cell group. When compatible BMS data is available, compare individual cell voltages, spread, temperature, and alarms with the battery maker's limits.
Sources and reference notes
- Renogy, Car Battery Voltage Chart Guide - Includes one LiFePO4 resting-voltage and SOC chart; its values are product-dependent examples, not a universal curve.
- PowMr, Guide for LiFePO4 Voltage Chart & SOC - Explains nominal voltage, series scaling, SOC, and why charging voltage changes during a cycle.